In today’s fast-paced digital world, infographics have become one of the most effective tools for communicating complex information quickly and clearly. Whether you’re a marketer, educator, or business owner, using infographics can help you capture attention, boost engagement, and improve information retention. This article will explore what an infographic is, why it’s so effective, and how you can create compelling infographics for your audience.
What Is an Infographic?
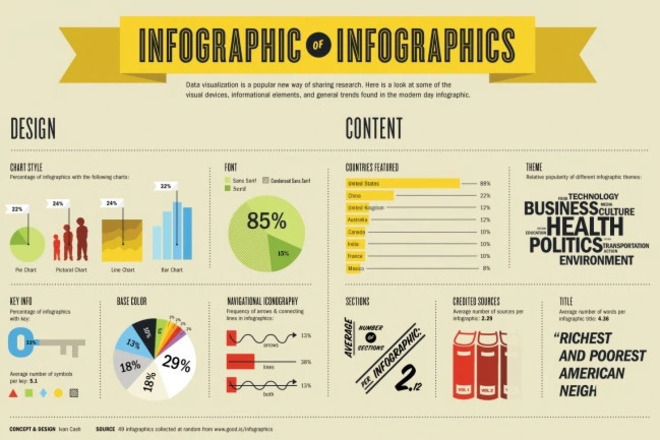
An infographic is a visual representation of data, information, or knowledge designed to present information quickly and clearly. By combining text, images, charts, and icons, infographics simplify complex topics and make them more digestible for viewers.
Unlike plain text content, an infographic can guide the reader’s eye and deliver a message with fewer words but greater impact. This makes it an excellent tool for content marketing, social media, education, and business communications.
Why Are Infographics So Effective?
Infographics are highly effective for several reasons:
1. Visual Appeal
Humans are visual creatures. Studies show that people retain 65% of information when it’s paired with relevant images. Infographics leverage this by turning data into eye-catching visuals.
2. Easy to Digest
Dense information can be overwhelming, but an infographic breaks it down into manageable parts. Bullets, icons, and color-coded sections guide the viewer through the content smoothly.
3. Shareability
Infographics are highly shareable, especially on social media platforms like Pinterest, Instagram, and LinkedIn. A well-designed infographic can go viral and increase your brand visibility.
4. Boosts SEO
Because they encourage backlinks and increase time on site, infographics can significantly enhance your SEO performance. When other websites link to your infographic, it signals to search engines that your content is valuable.
Types of Infographics
Depending on your content goals, there are several types of infographics to choose from:
- Statistical Infographics: Great for showcasing data, research, or survey results.
- Informational Infographics: Ideal for explaining processes, concepts, or lists.
- Timeline Infographics: Useful for visualizing history, project timelines, or evolution of a topic.
- Comparison Infographics: Perfect for highlighting differences or similarities between two or more options.
- Hierarchical Infographics: Best for displaying structures, like organizational charts or step-by-step processes.
How to Create an Effective Infographic
Creating a powerful infographic involves more than just pretty graphics. Here’s a step-by-step guide:
1. Define Your Goal
What message do you want to convey? Your goal will determine the type and structure of your infographic.
2. Know Your Audience
Design and tone should align with your target audience’s interests and preferences. A professional B2B audience may prefer minimalist styles, while a younger demographic may enjoy bright, playful designs.
3. Gather Accurate Data
Make sure your content is factual, up-to-date, and from reputable sources. Infographics lose credibility if the data is flawed.
4. Use a Clear Layout
Organize the information logically. Use sections, headers, and visual flow to guide the reader from beginning to end.
5. Choose the Right Tools
There are several online tools to create infographics, such as Canva, Piktochart, and Venngage. These tools offer templates and drag-and-drop features for easy design.
6. Optimize for SEO
Add an SEO-friendly title, alt text for images, and embed the infographic in a relevant blog post. Don’t forget to include share buttons to encourage distribution.
Infographic Best Practices
To ensure your infographic performs well, follow these best practices:
- Keep it simple: Avoid clutter. Stick to essential information.
- Stay on brand: Use consistent fonts, colors, and logo placement.
- Use high-quality visuals: Low-resolution images can make your infographic look unprofessional.
- Tell a story: Use the infographic to lead your audience through a narrative.
- Cite your sources: Add credibility and allow readers to explore more.
Conclusion
Infographics are a powerful content marketing tool that combines design and data to deliver impactful messages. They help engage audiences, improve retention, and enhance SEO. By using infographics in your content strategy, you can stand out in a crowded digital landscape and provide real value to your audience.
Whether you’re explaining a process, sharing statistics, or comparing options, the right infographic can make all the difference. Start creating today and let your content speak visually.
